Friday, December 4, 2015

North and South European ancient roots estimated using Dstat

Before moving ahead with new ideas I decided to make one more qpDstat comparisons using recently released ancient sample set and Estonian Biocentre's data. 

Qualifying the data using larger 1000genome data shows certain statistic error in EBC data and I am not happy to see that the EBC data with less SNPs distorts at least Finnish samples. 

Now I split 100 Finnish samples (downloaded from the 1000genome project) into two groups using qpDstat instead of using PCA, which seems to lead to a bias towards homogeneous and/or recently formed  populations.   The first Finnish group includes most similar samples with Corded Ware samples found from Germany, exluding 5 individuals showing more Swedish admixture than me. Usually I get in Gedmatch tests 5% less recent western admixture than average Southwestern Finns. Many approved samples show however more Corded Ware than me.  Another Finnish group includes samples showing least Corded Ware similarity.  It is of course possible to make different intrapopulational selections, but using Corded Ware samples made sense in a larger scale.

All sample sets are compared to British Kent poople.   I selected them because I thought them being a good fixed point and well-known for American readers.  I think that Irish or Orcadian samples could have been better though, just because they live on the opposite European fringe to the Bronze Age migrations. 


Friday, November 27, 2015

Indigenous European Hunter-gatherer origin of Finns

I have been busy for a while with this blog, but after this writing I am going to start a new project and stay away from here for two weeks in preparing new data.

It has been some discussion about the origin of Finnish people.   Did they come from north, east, south or west?   But absolutely not from above or below.  An estimate given by Haak et al. 2015 gives us the origin of Finns: 25% early Neolithic farmers (compared to Norwegians with 48% early Neolithic farmers), 10% Siberians (compared to Norwegian 4%), 8% western hunter-gatherers (Norwegian 0%) and  50% Yamnaya (Norwegian 48%).  Because the Yamnaya settlement was already mixed holding eastern, western and southern roots we can assume that this kind of mixture existing in Finland is not necessarily just from a Yamnaya migration.  To check it we can compare Finnish genome data to eastern and western hunter-gatherers.  If the western proportion is bigger than eastern then the Finnish admixture turns out to be more western, no matter how similar it is to the Yamnaya composition.  Here is the result from Haak et al. 2015


We see that the Finns have exceeding western hunter-gatherer admixture over the Yamnaya composition found from Norway, but we don't know how big the western proportion is, because we don't know exactly the Yamnaya composition.  So we can test it regarding Finns using one million SNP's now publicly available.

 
The result shows without doubt that the Finns are closer Loschour (WHG) than Karelian HG.  It shows just the same for Samara hunter-gatherers;   the Finns are much closer WHG than Samara.  And again, the same happens with western Motala_HG, both Eastern hunter-garherer groups are more distant. But a surprise comes from Hungary.  Hungarian hunter-gatherers beat also western hunter-gatherers being the closest group for Finns.

Revised Treemix-analysis using Karelian Hunter-Gatherer

In my previous Treemix test the result for Karelian hunter-gatherer (aka Karelia_HG in most studies) was tentative due to low SNP amount.  Now I have a new sample covering around 80-90% of the used data.


After adding Finnish Tavastians they took the  pole position.


Wednesday, November 25, 2015

Dstat using one million SNP's

I have now a great possibility to use up to one million SNP's in testing ancient genomes, thanks for new data releases.  This gives of course much more accuracy in upcoming tests.  Before going ahead I'll take a freedom to use my own genome (I have not many individual genomes with on million SNP's) and compare it to British Kent people using qpDstat.   I use Kent people because they are available from the 1000g project and there with Cornish people only original Europeans outside Mediterranean region.   If  the fifth column is positive the result shows me being closer than Kent people to the population mentioned in the third column.


Monday, November 23, 2015

Northern hunter-gatherers portrayed by Treemix

After adding three northern hunter-gatherer groups to the data offered by Estonian BC I can now present them.  Karelia_HG is somewhat tentative based on only around 50000 snp's, converted from Haak et al.  I ran all results several times to estimate the trustworthiness.

Sweden-NHG stands for sampling Ajvide58.   You find more information about used ancient samples from here.   Most of my ancient samples are downloaded from there.


Additionally a Swedish farmer from Gökhem (Gokhem2)


Sunday, November 22, 2015

Analyzing ancient samples is not a piece of cake, an example

Testing ancient "steppe" samples on PCA together with modern ones revealed unexpected issues.  Studies have included different sets of modern samples, some use South Asians samples, but not East Asian ones.  Probably they assume that East Asians are not relevant when testing Europeans.  Maybe it is not true, because we try to verify thousands of years history and the migration process during that time is always at least partially unknown.  Let's look three PCA-runs with different compositions.  I published the first one in my previous blog entry, to the second one I include now South Asians and to the third one also East Asians.  Due to a limitation of my Gnuplot printing routine to handle populations names I had to remove some ancient and Uralic samples from the printing stage of two global views, but PCA analysis in each phase include all samples creating proper values of x- and y-axes.   The Gnuplot routine I use tries to fit all on one page.   So I present here two PCA-plots in all three phases, each including global and close-up views.  Close-ups include all same global samples and their impact and are made only for better resolution.

In my previous analysis all "steppe" samples located very close modern Europeans.  Making  it simple let's follow Bronze Age Scandinavians (baSca).  They seem to be the westernmost group of all Bronze Age samples.


After adding South Asians all "steppe" samples move eastwards and Bronze Age Scandinavians with them to the same direction.  Regarding "steppe" samples this starts to look like Jones et al.  Sorry about flipping pictures, SmartPca does it sometimes. 


After adding East Asians changes happen again, "steppe" samples move back to west and some of Bronze Age Scandinavians are now among Basques (this is interesting indeed, think about western megaliths, but let's forget it now).


As a conclusion I would say that it is not always relevant to make up one's mind about clines between modern and ancient samples if we are not aware of the history between ancient and modern samples.   We can select modern samples coincidentally or even in a prejudiced manner and perhaps lose meaningful history.   

Monday, November 16, 2015

Basic tests with ancient samples using Treemix

Following strictly all instructions given in manual by authors I at first made PCA-plots in two steps.   At first I selected modern populations on what the ancient sample set is to be projected.  So I did a projected plot using SmartPca.

Here is a big view


And here a close-up with impact of all same populations


This looks somewhat different than we have seen in studies.  However I think that my arrangement with modern populations is objective and projected ancient samples should be on right places.  There is some extra effect using more East Asian samples, which makes me wondering what is the history which makes this difference between modern and ancient samples.  It looks like there is in modern Europe a hidden East Asian effect lacking in ancient samples (including so called "steppe populations").

Here is a set of TreeMix results using ancient and modern Europeans.  Some observations on results

-  although the tree itself expresses course from hunter-gatherer and "steppe" populations to early farmers TreeMix gives in some cases extra migrations from ENF to other South European populations.

- during the Bronze and Iron Age migration history in Europe many changes took place.  It looks like Southwestern Finns are closest to original western hunter-gatherers among modern populations.  This is true despite of some eastern influence in Finland.  Even so the drift distance between western hunter-gatherers (Loschbour) and the Finns is almost equal with other modern Europeans.


Thursday, November 12, 2015

Revised information of HGDP Mongola samples

I used in my previous test HGDP's Mongola samples

HGDP01223, HGDP01224, HGDP01225, HGDP01226, HGDP01227,         HGDP01228, HGDP01229, HGDP01230, HGDP01231, HGDP01232

All those samples look like being more European than I expected.   In purpose to check who they really are I included Tatar samples into similar tests and the result shows that Tatars ( from the study "The Genetic Legacy of the Expansion of Turkic-Speaking Nomads across Eurasia", link http://journals.plos.org/plosgenetics/article?id=10.1371/journal.pgen.1005068) share much common drift with those Mongola samples.   Their drift differs in a manner Tatars are closer Eastern Uralic people and some Slavic - Finno-Ugric mixed populations, like Mordvas, and Mongola samples are closer Slavs, like Belarussians.   Whatever those Mongola samples are and how they are named, their drift fits between Tatars and Slavs although I have no idea about the history. They look like just a real Mongolian group with less Uralic admixture than Tatars, but Mongola samples share a strong migration drift with Tatars, although Mongola samples seem to be mainly Central Asians. A bit complicated story for people who are interested in Mongolian influence in Europe.  A question without answer is why Mongola samples have more drift with Slavs than Finnic/Finno-Ugric people.  


Wednesday, November 11, 2015

More Treemix-runs

I have now tested Treemix-software and found something good and something bad.  I think that it is a great software giving reliable results, but it looks to be also buggy hanging itself very often. 

Giving basic information I have run several Treemix-graphics to show basic information how European populations are related by genetic drift.  The give a big view it is necessary to look things from different angles changing the root population.  Every different root arrangement reveals something, the big picture is to be composed in readers' minds.  

Have a fun with following results!


Saturday, November 7, 2015

Introducing Treemix

During the next days or weeks I am going to run several Treemix-analyses targeting to regional migrations among present-day Europeans.  My first run figures migrations in Finland, but please keep on following this work, because I'll do several analyses covering most regions in Europe and neighboring areas.

What we see in Finland (as derived from the result)

- prehistoric Germanic migration to Southwest Finland
- Swedish migration to Finland
- post-Tavastian migraton to Estonia
- Finno-Ugric (pre-Finnic) migration to Komi (which definitely indicates Komi being a mixed Finno-Ugric population with European root of another kind


Post-Tavastian likely  means the age before Finland was populated by present-day Finns.


There is also a migration from France to Poland, but solving it needs more western and Central European samples.  Next runs will be more focused on this issue.

This Treemix run was executed using global setting, with no root and the migration count 5.


Tuesday, November 3, 2015

Testing common ancestry without recent genetic drift

Standard structure and admixture-analyses miss information of populational history by amplifying most common allele linkages between individuals and by distorting  gene flows and flow directions.  I have built a new testing installation figuring allele mismatch between test groups.   In this test a small mismatch doesn't tell straightly difference or similarity between individuals.  Instead of small differences, which actually usually can't be identified by origin and long history, the amount of shared alleles entirely in object population tells the story.

So the result indicates what is entirely common between proposed admixture groups and tested individuals and the test dismisses distinct admixtures.  Admixture and Structure, as well as PCA, do the trick conversely, creating a wow-effect if there is minor admixtures or recent genetic drift. 

But to avoid the impact of genetic drift the comparison is in my test done using non-related third reference populations as middlemen.  As far as I can tell in case of Finns the calculated allele mismatch matches well with the known history.  In other words, distinct admixtures and recent genetic drift are disregarded and the results show a common root of object populations and tested individual.

I have now tested people belonging to my project, excluding Scandinavians.  For Scandinavians I'll do another test case, because they need very different admixtures than Finns.  

Average allele mismatch figures for Southwest and East Finns:

East Finnish / Sweden  87
East Finnish / West Russia 54
East Finnish / Estonia 29
East Finnish / Karelia 8
East Finnish / Veps 11
East Finnish / Poland 84

Southwest Finnish / Sweden  37
Southwest Finnish / West Russia 23
Southwest Finnish / Estonia 7
Southwest Finnish / Karelia 29
Southwest Finnish / Veps 36
Southwest Finnish / Poland 39

Project members' results:


Equivalences for old project member identity codes

HM0001 = FI1
LS0001 = FI2
LS0002 = FI3
LS0003 = FI4
KA0001 = FI5
LS0004 = FI6
announcement sent = FI7
announcement sent = FI8
announcement sent = FI9
SK0001 = FI11
me = FI12

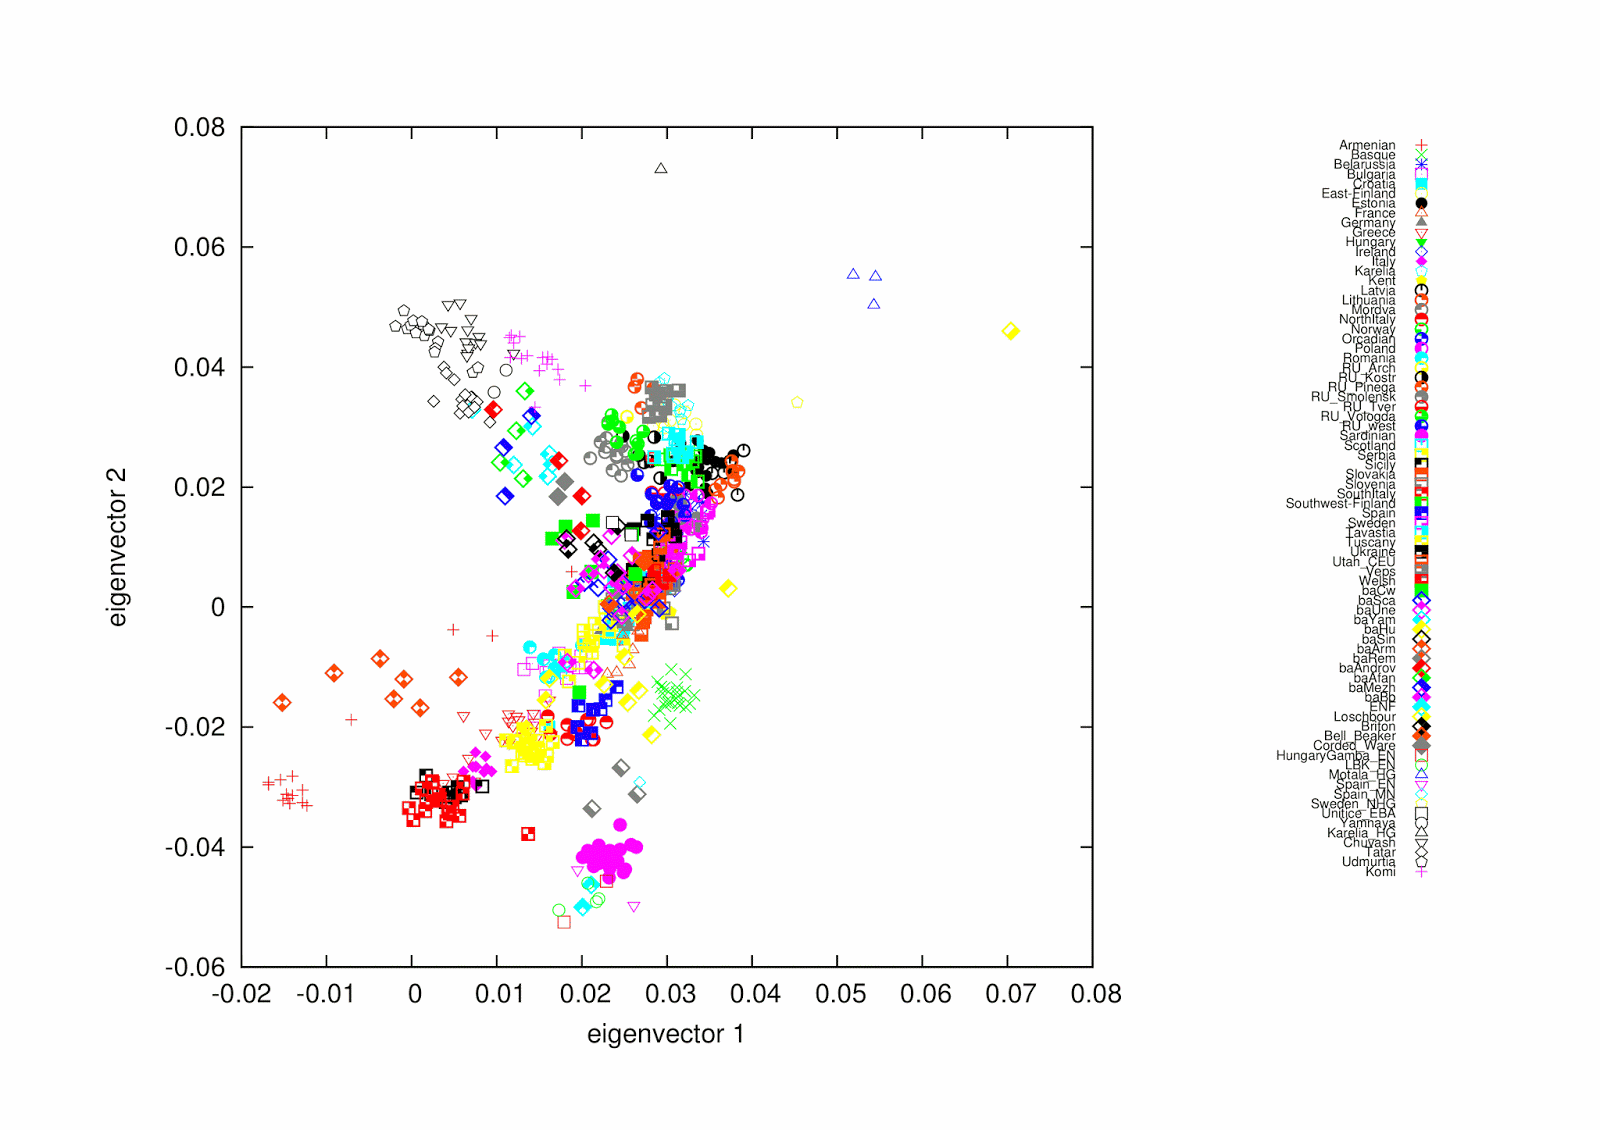
For data checking here is a PCA (look, it smiles):


edit 6.11.2015

Here are results for Swedish project members.  Some notes

- SC2 has probably Baltic or Slavic admixture
- SC3 has West Russian and possibly Southwest Finnish admixture
- SC6 has more Finnish admixture


I understand that readers can question those non-Swedish admixtures and I appreciate if SC2, SC3 and SC6 could leave their truthful comments anonymously here.


Something to notice that none of those admixtures can be seen on PCA.


Wednesday, October 21, 2015

Dedicated admixture analyses for Scandinavians and Finns

It has gone a while since the last admixture analysis because I saw them unreliable.   In priciple you can make very bad admixture abalyses, and probably do if you have not any method to confirm the coverage of allele frequencies regarding used k-populations.  But today it is possible to check the coverage using qpAdm. It is easy to see that most admixture analyses I have done before have been very bad.  Checking things using qpAdm revealst tha we can't do one analysis for all people on the earth, not even for one continent.

My first experiment is now downloadable here and consists of two local analyses, one for Finns, one for Scandinavians.   Both analyses are taylored giving best possible allele frequency match checked by qpAdm before running allele distribution files.  However, admixture analyses in general have two big disadvantages:

-  admixture analyses can't reach deep prehistory.  If you want to test for example Bronze Age migrations you have to use other tools, like qpDstat and qpAdm. 

- admixture analyses (like Structure and Admixture)  try to model linkages between individuals, but fail to detect right gene flows.  For that reason admixture analyses can at best give only estimates and the quality depends strongly on the data preparation.  I have tried to minimize this gene flow error, but results are still biased in some extent and in gereral the resolution is too low and actual differeces between k-group results are higher than given by these analyses.  My analysis gives maximum difference of 15% in Ladogan admixture in Southern and Central Finland and the right maximum is around 25% estimated using regional Fst-values and qpAdm. 

Some notes

- Ladogan means eastern Finnic people nearby Ladoga lake.

- North-Baltic means Latvians and applicable Estonians.

- Fennoscandinavian means old common genetic background for Finns and Scandinavians.  It mainly refers to Scandinavian migrations, but I prefer to call it Fennoscandinavian to avoid confusion between prehistoric and historic migrations.

- West-Europe means mainly western Germanic affinity (Northwest Europe).

- it is useless to use analysis not dedicated to your ethnicity (Finns/Swedes), because using wrong test files leads to obvious coverage mismatch of allele distributions.  The same mismatch happens less or more in all analyses of this same type.


Diydodecad files for both tests are downloadable here.


In running analyses use parameters “scan.par" and "fin.par".   More detailed instructions about Diydodecad and installation can be found here and original Diydodecad files are downloadable here.  My download package however includes all necessary to run tests.


Monday, September 28, 2015

Using Bedouins as a reference, false or true history?

If we want to make true admixture analyses we need good ancestral references, but because we have not valid ancient genomes from Middle East we have used Bedouins to represent ancient unmixed Middle Easterners.  I have now tested them using qpDstat, Denisova and Neanderthal genomes as outgroups.  There is no way to predict how good those hominids can be, so let's look results.

 
In my opinion the result clearly shows African (Yoruba) similarity for Bedouins, meaning that if Bedouins are used as a reference some African admixture becomes hidden in results.  Also, it is hard to say how old this African similarity is.  It could be very recent or very old, but it is definitely present and distorts results in admixture analyses. 

There is certainly a statistical error due to the bad reference sampling, but in a big view the result is definitely directional.