Wednesday, January 11, 2023

Holy Grail of the Uralic languages, the origin in Siberia

 It has gone a couple of years since a new Siberian-like Bronze Age sample was found from Central Siberian Krasnoyarsk.  Almost every blogger being interested in population genetics started soon to speculate if this Bronze Age man belonged to the first speakers of Uralic languages and the reason was, actually two reasons, Siberian origin and that the man belonged to the male haplogroup N.  In my opinion this conclusion was debatable.  Definitely he belonged to purest North Siberians, among many other Siberian people.  Definitely the yDna haplogoup N is common among modern Uralic speakers, but N is common also in other language groups.  Genes don't have language, languages don't have genes.  This poor Bronze Age man will never reveal his language.  Only thing common with his genes and the origin of Uralic languages is Siberia. Can we say that only one language was spoken in an area extending thousands kilometers to every direction, that this man and his kinship kept connection by  yoiking over hundreds kilometers?  Languages need common society and culture to strenghten enough to make further expansions.  One man has one male haplogroup, but he needs society and common culture within a larger social context to be able to advance something.  In the other hand even his genes were not unique in Siberia.

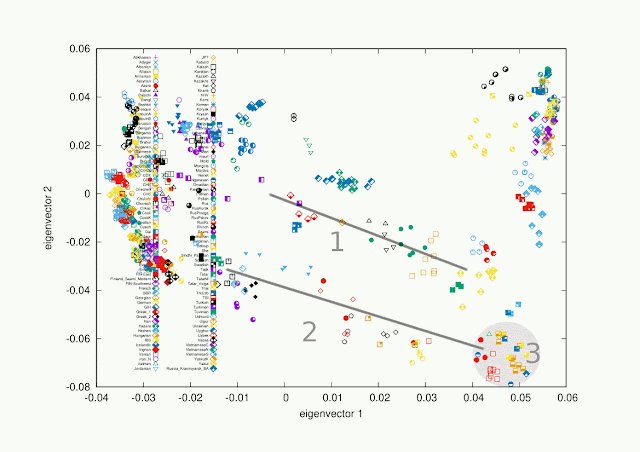
To have something real in my hands I made tests, a PCA-plot and a series of qp3Pop analyses.  On the PCA there was nothing particular to mention; the Krasnoyarsk man was on two first dimensions pretty much like many other pure Siberians.  Making Eurogenes G25-style multifimensional analysis would be great, maybe Eurogenes want to do it.  But then the f3-analysis revealed something.  I made two analyses comparing almost all populations I found in the North Siberia-Europe  cline to Nganasans and to the Krasnoyarsk man.  Finally I divided the Krasnoyarsk result by the Nganasan result to get the ratio of all population in the cline.  The ratio revealed that despite of  small Siberian admixture some populations had a high Krasnoyarsk ratio, including Finns.  May this mean that those with high ratio formed at least partially the westward migration of Uralic speakers?


2 - North Siberia - Europe cline

3 - North Siberians


Green color - high Krasnoyarsk_BA ratio.
Friday, January 6, 2023

A new study sheds light on Scandinavian Iron Age ancestry

Rodríguez-Varela et al. makes an effort to find out eastern and western influences in Iron Age Scandinavia.  Results support ideas of western migrations during the Swedish Vendel Era, especially from England.  Migration Period and the  following so called Vendel Era in Sweden are known about common artefacts with Anglo-Saxon England, which supports the outcome of the study of migrations from the British Isles, at least what comes to the Anglo-Saxon genetic influence. 

 Another observation in the study covers the eastern influence in Uppland and in more northern areas.  The study speaks about Uralic influence, which is somewhat troublesome, because genetic information doesn't include information about spoken languages.  On the other hand it mentions Finnish influence, so we can make a conclusion that the study actually means Finnish (but not Estonian)  influence, as a special case of Uralic speakers, without proving straight connection to the Ural region (where Uralic language speakers are only a minority).  On the other hand the study speaks about Eastern Baltic influence, which also leaves me uncertain of the actual meaning. Also, the study tells that the north-south cline in Scandinavia proves about the migration route of Uralic speakers, but is it similarly possible that this cline proves about SOUTHERN migration DILUTING the original population in Scandinavia - whatever language they spoke?  From history books we know that in Scandinavia, and also in Finland and Russia, the migration direction was from south to north rather than conversely.  Isn't this even more credible, not only based on known history, but also based on earlier conclusions of this study?


 The biggest shortage is that the study focuses mainly on middle and late Iron Age samples and the data doesn't include early Iron Age (Pre Roman Iron Age) and late Bronze Age samples.  This shortage leaves us without view of how the Scandinavian genetic  profile looked before the Anglo-Saxon impact and it doesn't take into account possibility of  earlier eastern and western influences.  In my opinion people in Sweden were before the Migration Period significally  more eastern than later, but then is it right to call that time Uralic or Eastern Baltic?  What would be Western Baltic then?  And why the study doesn't check the Western Baltic influence if it exists? It was interesting to read the study, despite many unclear definitions.

Wednesday, January 4, 2023

Baltic Finns as a construction of Bronze and Iron Age admixtures IV

 Peltola et al.  g25-samples are now available.  I reran previous tests after adding those new samples.  It looks like Volga-Oka Iron Age samples have some effect on results, but not anyway predominating.  Southeast, North, Central and East Finland get some meaningful portion. 

BOL - Volga Oka IA, representing people before the Slavic eastern migration.

For sample details please look at the study. Link: 

https://www.cell.com/current-biology/fulltext/S0960-9822(22)01826-7

Target: Mauri1million_scaled
Distance: 0.4878% / 0.00487819
25.2    England_MIA
23.0    Baltic_EST_BA
10.8    RUS_Ingria_IA
10.4    England_MIA_LIA
7.6    UKR_Shestovitsa_VA
4.4    RUS_Krasnoyarsk_MLBA
4.2    Baltic_EST_MA
4.2    England_Saxon
4.0    FIN_Levanluhta_IA
3.0    SHK002
2.4    SHK001
0.6    RUS_Krasnoyarsk_BA
0.2    BOL005

Target: Estonian
Distance: 0.4453% / 0.00445321
29.8    Baltic_EST_BA
20.4    England_MIA
13.6    Baltic_EST_MA
11.6    KED001
8.6    KRS001
8.6    RUS_Ingria_IA
2.8    BOL004
2.2    KED002
2.0    UKR_Shestovitsa_VA
0.2    FIN_Levanluhta_IA
0.2    RUS_Krasnoyarsk_BA

Target: Finnish_Southwest
Distance: 0.7118% / 0.00711846
26.2    England_MIA
17.6    Baltic_EST_BA
15.4    RUS_Ingria_IA
14.4    FIN_Levanluhta_IA
13.8    England_MIA_LIA
6.2    UKR_Shestovitsa_VA
3.8    KED001
1.4    RUS_Krasnoyarsk_MLBA_o
1.2    RUS_Krasnoyarsk_BA

Target: Finnish_Southeast
Distance: 0.6699% / 0.00669896
28.4    Baltic_EST_MA
23.8    England_MIA
11.4    BOL005
10.0    Baltic_EST_IA
10.0    England_LIA
8.0    FIN_Levanluhta_IA
6.4    Baltic_EST_BA
1.2    RUS_Krasnoyarsk_BA
0.8    KRS001

Target: Finnish_North
Distance: 0.9945% / 0.00994463
23.0    FIN_Levanluhta_IA
21.8    England_MIA
19.0    RUS_Ingria_IA
14.6    Baltic_EST_BA
11.4    BOL004
8.4    England_MIA_LIA
1.6    UKR_Shestovitsa_VA
0.2    Baltic_EST_MA

Target: Finnish_East
Distance: 0.7742% / 0.00774249
21.8    Baltic_EST_MA
21.0    Baltic_EST_IA
13.6    BOL005
13.2    FIN_Levanluhta_IA
8.2    England_MIA
6.4    England_MIA_LIA
5.4    Baltic_EST_BA
5.2    BOL009
4.0    England_Saxon
0.8    England_IA
0.4    RUS_Krasnoyarsk_BA

Target: Finnish_Central
Distance: 0.6841% / 0.00684063
19.2    Baltic_EST_BA
19.0    England_MIA
14.0    Baltic_EST_MA
12.8    FIN_Levanluhta_IA
10.4    BOL004
7.0    England_IA_EarlyMedieval
4.2    RUS_Ingria_IA
4.0    England_Saxon
3.8    England_MIA_LIA
3.6    KED002
1.6    RUS_Krasnoyarsk_BA
0.4    Baltic_EST_IA

Reducing population number erases IA-samples.

Target: Mauri1million_scaled
Distance: 2.0489% / 0.02048857 | ADC: 2x RC
41.6    KBL002
40.8    UKR_Shestovitsa_VA
15.0    KED002
2.6    GOS002

Target: Estonian
Distance: 1.7521% / 0.01752108 | ADC: 2x RC
30.6    Baltic_EST_MA
27.4    Baltic_EST_IA
27.0    KED001
15.0    KED002

Target: Finnish_Southwest
Distance: 2.1900% / 0.02190021 | ADC: 2x RC
53.6    KED001
46.4    UKR_Shestovitsa_VA

Target: Finnish_Southeast
Distance: 2.5633% / 0.02563278 | ADC: 2x RC
32.8    KRS001
31.0    Baltic_EST_IA
21.2    GOR001
15.0    KED002

Target: Finnish_North
Distance: 3.7546% / 0.03754556 | ADC: 2x RC
100.0    GOR001

Target: Finnish_East
Distance: 3.0876% / 0.03087553 | ADC: 2x RC
100.0    GOR001

Target: Finnish_Central
Distance: 3.4461% / 0.03446146 | ADC: 2x RC
100.0    GOR001


Tuesday, January 3, 2023

Baltic Finns as a construction of Bronze and Iron Age admixtures III

 To be on the safe side regarding selected eastern Krasnoyarsk samples I made a g25-test using ALL available ancient samples to figure out Southwest and Eastwest Finns.   The reason for selecting Krasnoyarsk samples was the fact that they look on drift tests promising sources for Baltic Finns.  Yet I want to see new Volga Oka samples and want to search suitable western pairs for them.  Hopefully Eurogenes author can offer them in the near future.

Target: Finnish_Southeast
Distance: 0.7026% / 0.00702565 | ADC: 0.25x RC
24.8    NOR_North_VA_o2:VK519
14.0    ISL_Viking_Age_Pre_Christian:NNM-A-1
13.0    Baltic_EST_IA:s19_V10_2
12.6    SWE_Viking_Age_Sigtuna:vik_KAL006
9.0    NOR_Mid_MA:VK124
8.0    SRB_Viminacium:R9673
6.8    EST_Saaremaa_EVA:VK554
6.0    DNK_Sealand_VA:VK215
3.6    Baltic_EST_IA:s19_VII4_1
1.2    RUS_Ladoga_VA:VK21
1.0    DNK_Funen_VA:VK371

Target: Finnish_Southwest
Distance: 0.5735% / 0.00573538 | ADC: 0.25x RC
24.6    DNK_Langeland_VA:VK367
17.4    DNK_Sealand_EVA:VK297
13.4    SWE_Gotland_VA:VK462
11.6    FIN_Levanluhta_IA:JK1968
8.8    SWE_Gotland_VA:VK472
8.0    SWE_Gotland_VA:VK51
5.2    FIN_Levanluhta_IA:DA234
3.8    RUS_Ladoga_VA:VK408
3.6    DEU_Tollense_BA:WEZ40
2.4    SWE_Viking_Age_Sigtuna:vik_84005
1.2    UKR_Shestovitsa_VA:VK539

This would be nice, but only if we forget eastern origins of Baltic Finns, with exception of Levanluhta and Norwegian Saami.  Negative side is that our history should be written newly, because we would be descendants of Vikings.  We are not. Dilemma we have with our history ought to be seen. 

Monday, January 2, 2023

Baltic Finns as a construction of Bronze and Iron Age admixtures II

 For those who trust in g25-results and use g25-model as a reference in various contexts, I made examples using original g25-sources listed in my previous post and now using original modern g25 population averages as targets.  Its is obvious that if anyone, including Finnish researchers, wants to assume eastern genetic origin of Baltic Finns, this hypothesis leads to a very western admixture compensation in all Baltic Finnic populations, but is  observable only as a minor western admixture in Baltic populations, like Latvians and Lithuanians.  

This is true regardless of the origin of the Baltic Finnic language and in my opinion researchers in population genetics  make an unintelligible mistake when continuing research like they do as things currently stand.  A magic solution is to use Baltic Finns as a reference of Baltic Finns without eastern admixture options, just like for example 23andMe does.  This abracadabra sounds like an only solution just because Baltic Finns are an unique admixture of west and east, but why don't you  use the original admixture instead of invoking tautology?  Extra benefit would be a genetic evidence of the origin of the Baltic Finnic language.  

Target: Finnish_Southwest
Distance: 0.7206% / 0.00720570
26.6    England_MIA
18.6    Baltic_EST_BA
16.8    RUS_Ingria_IA
14.4    England_MIA_LIA
13.8    FIN_Levanluhta_IA
5.2    UKR_Shestovitsa_VA
1.8    RUS_Krasnoyarsk_MLBA_o
1.4    England_IA_EarlyMedieval
1.4    RUS_Krasnoyarsk_BA

Target: Finnish_Southeast
Distance: 0.7483% / 0.00748311
27.0    Baltic_EST_MA
19.8    England_MIA
16.0    Baltic_EST_IA
12.6    England_LIA
11.6    FIN_Levanluhta_IA
9.4    Baltic_EST_BA
1.8    England_IA_EarlyMedieval
1.8    RUS_Krasnoyarsk_BA

Target: Finnish_North
Distance: 1.0307% / 0.01030739
28.6    FIN_Levanluhta_IA
22.4    England_MIA
19.2    RUS_Ingria_IA
18.0    Baltic_EST_BA
9.6    England_MIA_LIA
2.0    RUS_Krasnoyarsk_MLBA_o
0.2    RUS_Krasnoyarsk_BA

Target: Finnish_East
Distance: 0.8937% / 0.00893685
23.4    Baltic_EST_MA
22.8    Baltic_EST_IA
18.2    FIN_Levanluhta_IA
10.4    Baltic_EST_BA
6.4    England_Saxon
5.2    England_MIA_LIA
4.6    RUS_Krasnoyarsk_MLBA
4.4    England_LIA
3.2    England_MIA
1.4    RUS_Krasnoyarsk_BA

Target: Finnish_Central
Distance: 0.7321% / 0.00732105
25.4    Baltic_EST_BA
21.0   England_MIA
16.2    FIN_Levanluhta_IA
13.2    Baltic_EST_MA
8.2    England_Saxon
5.2    England_IA_EarlyMedieval
3.8    RUS_Ingria_IA
2.6    England_MIA_LIA
2.4    RUS_Krasnoyarsk_BA
2.0    RUS_Krasnoyarsk_MLBA_o

Target: Karelian
Distance: 0.5298% / 0.00529849
35.0    Baltic_EST_BA
16.4    FIN_Levanluhta_IA
12.8    Baltic_EST_MA
11.0    England_IA_EarlyMedieval
7.0    England_MIA
4.8    England_MIA_LIA
3.8    UKUKR_Chernigov_VA_o
3.6    RUS_Krasnoyarsk_BA
2.8    England_IA
2.8    RUS_Krasnoyarsk_MLBA_o

Target: Vepsian
Distance: 0.7665% / 0.00766456
38.0    Baltic_EST_BA
14.2    FIN_Levanluhta_IA
11.8    England_IA
11.8    England_MIA
6.4    Baltic_EST_MA
6.2    UKUKR_Chernigov_VA_o
5.4    RUS_Krasnoyarsk_BA
3.0    RUS_Ingria_IA
2.0    England_IA_EarlyMedieval
0.6    England_Saxon
0.6    RUS_Krasnoyarsk_MLBA_o

Target: Saami
Distance: 1.1439% / 0.01143915
65.0    FIN_Levanluhta_IA
10.4    Baltic_EST_MA
6.8    RUS_Krasnoyarsk_MLBA_o
4.2    Baltic_EST_IA
4.2    RUS_Krasnoyarsk_BA
3.6    England_LIA
2.6    England_MIA_LIA
2.0    Baltic_EST_BA
1.2    England_MIA

Target: Saami_Kola
Distance: 0.6132% / 0.00613244
33.6    FIN_Levanluhta_IA
15.2    Baltic_EST_BA
15.2    Baltic_EST_IA
13.0    Baltic_EST_MA
8.4    RUS_Krasnoyarsk_BA
5.0    England_EIA
4.6    England_LIA
3.0    England_MIA
2.0    RUS_Krasnoyarsk_MLBA_o

Target: Estonian
Distance: 0.5235% / 0.00523480
31.0    Baltic_EST_BA
20.0    Baltic_EST_MA
15.2    England_MIA
10.4    UKUKR_Chernigov_VA_o
9.2    RUS_Ingria_IA
5.0    FIN_Levanluhta_IA
4.6    England_IA_EarlyMedieval
3.2    England_IA
0.6    UKR_Shestovitsa_VA
0.4    RUS_Krasnoyarsk_BA
0.4    RUS_Krasnoyarsk_MLBA


Finally I added ancient Baltic samples  to sources to see if they could make a perfect match for Finns without western proportions..  They don't do it, they don't even exist in results.  Only Estonian Bronze Age sources are eligible, obviously because Baltic samples have too high East European affinity.

Baltic_LTU_BA, Baltic_LVA_BA added.

Target: Finnish_Southwest
Distance: 0.7206% / 0.00720550
26.8    England_MIA
18.8    Baltic_EST_BA
16.8    RUS_Ingria_IA
14.4    England_MIA_LIA
13.8    FIN_Levanluhta_IA
4.8    UKR_Shestovitsa_VA
1.8    RUS_Krasnoyarsk_MLBA_o
1.4    England_IA_EarlyMedieval
1.4    RUS_Krasnoyarsk_BA

Target: Finnish_Southeast
Distance: 0.7517% / 0.00751654
27.4    Baltic_EST_MA
21.6    England_MIA
16.6    Baltic_EST_IA
11.6    England_LIA
9.8    FIN_Levanluhta_IA
9.6    Baltic_EST_BA
2.4    RUS_Krasnoyarsk_BA
1.0    England_IA_EarlyMedieval


Sunday, January 1, 2023

Baltic Finns as a construction of Bronze and Iron Age admixtures

 Without taking specific position of the ancestry of Baltic Finnic populations I selected best fitting Eurogenes g25-samples from a file published by the Eurogenes author and drove them through the Vahaduo admixture estimator.  The file was updated in the beginning of December 2022.  It lacks of samples looking promising in my f3- and Dstat-tests, like several Germanic samples from the Medieval or Migration Period, and some newer samples from new studies, which we are still waiting for, like samples from Volga Oka. 

Now gathered original (not simulated) g25-samples works only with Baltic Finns, including Finns, Estonians and Karelians, suggesting a distinctive admixture profile of them.  Results give typically a distance between 1.5-3%, usually around 2% or a bit less, but I have limited amount of individual samples to test with, just enough to see guidelines.  So I appreciate reader tests and posting results as comments.  Here is my result:

Target: Mauri_scaled
Distance: 1.9411% / 0.01941101
25.2    England_MIA_LIA
18.8    England_Saxon
18.2    Baltic_EST_BA
13.2    England_MIA
11.8    RUS_Ingria_IA
4.6    FIN_Levanluhta_IA
4.4    RUS_Krasnoyarsk_MLBA
3.4    RUS_Krasnoyarsk_BA
0.4    England_EastYorkshire_MIA_LIA
 

Target: Mauri_scaled
Distance: 1.9411% / 0.01941130
19.0    England_Saxon:I0773
17.4    Baltic_EST_BA:s19_V16_1
14.0    England_MIA_LIA:I21307
11.8    RUS_Ingria_IA:VIII5_2
11.4    England_MIA_LIA:I20626
7.2    England_MIA:I17261
5.0    England_MIA:I11997
4.0    RUS_Krasnoyarsk_MLBA:I1856
3.4    RUS_Krasnoyarsk_BA:kra001
2.8    FIN_Levanluhta_IA:JK1968
1.8    FIN_Levanluhta_IA:JK1970
0.8    Baltic_EST_BA:s19_X15_2
0.6    England_EastYorkshire_MIA_LIA:I13759
0.6    England_MIA:I3083
0.2    RUS_Krasnoyarsk_MLBA:I1851

G25 source file download:

https://drive.google.com/file/d/1ttCMVucenKEGof_6tswbnBlPYp4yrWwz/view?usp=share_link

Some lacking, but possible fitting samples:

England_EarlyMed_Saxon_oSteppe
Denmark_Zealand_Saxon_Med
Hungary_Langobard
NetherlandsGroningen_Saxon_Med
England_EarlyMed_Saxon
Germany_Schleswig_Saxon_LMed 

Aftermath:

It looks like Krasnoyarsk and Levanluhta are dominating, meaning that a small eastern proportion has important effect on how admixed samples act. Yet the sum admixture reaches a moderate fitting.  But no smoke without fire;  I made several Dstat-tests comparing my and Polish drift distances to all used g25 source samples dowloaded from Reichlab  (plus those I mentioned still lacking from the g25-source) and in most cases I was closer now used western g25 source samples.  In these Dstat-tests SNP numbers were over 0.9 million.

edit 2.1.2023 11:50 AM EET

More SNPs, more accuracy and a bit different composition. Yet close to the same east-west distribution.  English Saxon changed mostly to English Iron Age.

Target: Mauri1million_scaled Distance: 0.6521% / 0.00652080  
21.8 Baltic_EST_BA
21.2 England_MIA_LIA
20.0 England_MIA
11.6 RUS_Ingria_IA
9.6 FIN_Levanluhta_IA
5.8 RUS_Krasnoyarsk_MLBA
3.6 UKR_Shestovitsa_VA
3.4 England_Saxon
1.6 RUS_Krasnoyarsk_BA
1.4 Baltic_EST_MA