Sunday, September 19, 2021

A new Finnish study about yDna haplogroups

 A new study observes yDna haplogroup frequencies and CAD (Coronary artery disease), in Finnish sepelvaltimotauti) vulnerability of haplogoups in Finland.  Haplogroup frequencies show very close same number with the study Lappalainen et al. 2006, but differ from the study Neuvonen et al. 2015.  New haplogroup proportions are


N1c1 60,18 %
I1 26,44 %
R1a1 5,99 %
R1b 5,01 %
I2 0,97 %
E1b1 0,51 %

The study is dowloadable from the link in the end of the following textlink

Results figuring CAD are contradictory with another Finnish study.  This study (published in a Finnish medical magazin Duodecim by Joel Nuotio*, Tomi T. Laitinen* ja Markus Juonala, Link) gives following results, showing the highest vulnerability of CAD in East Finnish regions where the proportion of N1c1 is highest and the lowest vulnerability was found in Southwest regions where the N1c1 proportion is the second highest.  

Picture:


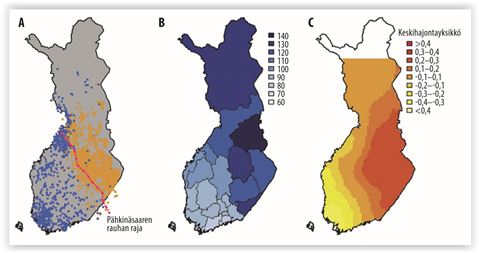
A - autosomal genetic structure in Finland

B - CAD incidence

C - genomewide CAD risk


I see two main factors involved with the disease vulnerability

- way of life

- autosomal inheritance


The Duodecim article shows the highest CAD incidence in the northeast and lowest in the southwest, both areas having the highest N1c1 proportions in Finland.  The way of life is today quite the same everywhere in Finland, thanks to the similar food markets and consistent culture  in the whole  country.  So what remains is differences in the autosomal inheritance.  Southwest and east have been isolated from each other hundreds years in the Finnish history and we can predict also significant difference in the autosomal inheritance of those two areas, the difference we can also see using autosomal genome tests.  Basically the areas of the HG I1 are between southwestern and eastern N1c1 areas and we can predict that the CAD vulnerability of I1 should be between the vulnerability of those two N1c1 areas. 


Tuesday, September 14, 2021

Patterns of genetic connectedness between modern and medieval Estonians and Finns

 A new Estonian study sets the connection between our countries to the 8th and 10th centuries AD and bases it on an assumed Estonian migration to Finland.  Sounds like Estonian self-seeking idea about  Estonian Vikings.  Heard before.  I have not knowledge about such Estonian migration.

  There have been a lot connections between our countries, but historians have never mentioned exactly aforementioned time frame as a significant event in our history.  Sure people have moved from Estonia to Finland, but also conversely.  Historians suggest that the main migration bringing the Baltic Finnic language happened during the Roman Iron Age and we know for sure that around 20-30% of the North Estonian population had Finnish origin after the Swedish era in the 17th century.  We know it because we have original documents.  Those times were very exhausting in Estonia due to many wars and the Estonian population size decreased remarkably.  

Such a Late Iron Age migration from Estonia should also be seen by an elevated R1a proportion in Finland, but the small R1a amount in Finland doesn't imply any Estonian origin.  I stay waiting for wider scientific stance.

Link


The grave of Viking female revealed many surprises

 It was long assumed that the grave was made for a woman, for a Viking queen or princess. Archaeological evidences spoke about a female, clothes and jewellery were typical for a female, but the luxurious sword gave a hint about a male.  The sword was so fine and luxurious that it has been a model for replicas sold under the topic "Sword of Suontaka Viking princess".  But genetic analyses  revealed that the buried one was not a typical man or woman, the remains showed signs of both, namely a chromosomal XXY structure.

Link


Monday, September 13, 2021

The dichotomy between Eurasian and African X chromosomal haplotypes

I made a statistics showing a full bifurcation between East-Asia and Africa. Showing high similarity in the whole Eurasia it is likely that the Eurasian haplotype is related to the OOA event. To see how much the African haplotype in Europe represents Near East migrations needs more investigation. The result implies however that not all and there have been different evolution and migration routes in Eurasia. The haplotype includes 15 SNPs.

Percentages of East Asian (pure African type is 100 - x)

Han Chinese 100
Southern Han Chinese 100
Japanese 100
Kinh Vietnamese 99.494949
Dai Chinese 98.92473
Punjabi 96.07639
Peruvian 94.70588
Bengali 92.48062
Sri Lankan 91.04575
Gujarati 90.64725
Mexican-American 89.8958
Indian 88.7255
CEPH (Utah Euro) 87.2727
Finnish 83.4007
Tuscan 82.0561
Colombian 81.5603
Spanish 80.9034
British 79.8535
Puerto Rican 70.1603
African-American SW USA 23.5519
African-Caribbean 8.1597
Luhya 7.71040000000001
Mende in Sierra Leone 3.098
Gambian 1.5044
Yoruba 0.987700000000004
Esan 0.808099999999996