Thursday, December 19, 2024

New Russian study is worth reading

 A new Russian study (-> link ) describes the history, genetics and migrations of the Baltic-Finnic groups around the Baltic, Ladoga and White Sea. Overall, I think the description is accurate. The usual conceptual blunders of non-Finns and non-Estonians regarding the words Finnic and Finno-Ugric are also largely avoided, but not completely. The research is groundbreaking in a way, because nothing similar has been done by Finns and Estonians. This does not mean that Finns and Estonians do not know the same things. However, this study provides a lot of new information for those less familiar with the subject.


Seen through the eyes of a Finn, the history of the eastern Baltic-Finnic groups gets a special mention, which I think is broadly correct. The division into Karelian language and Karelian dialect will not be made. I would have liked clarifications on other language issues as well. The timings of the migrations of the eastern Baltic-Finnic groups give special reason for thanks. I also found new information from these, and I strongly believe in the Russians' know-how. A small minus is that first the birth of these groups is described correctly as a result of the west-east migrations of the first millennium, which surprised me, because in Russian studies, Baltic-Finnic migrations to the Baltic Sea are usually described only in the opposite order, and then in the genetics part of the study, the grouping is done on the basis of eastern groups.


Seen on the basis of old information, the Tarand burial method is somewhat illogically connected to the easternmost branch of the N-haplogroup.  The branch Z1927 is characteristic for the eastern Baltic-Finnic groups and the Tarand graves are part of the western Baltic-Finnic culture. Although this contradiction is noticed, there is no explanation. The significance of the Tarand graves in the investigation of the origin of the Baltic-Finnic populations is seen as essential. However, it must be reminded that the presence of Z1927 in Karelia alone does not necessarily prove the direction of migration. Very often mixing of different populations and population bottlenecks cause local changes in both culture and inheritance, and it cannot be assumed that Z1927 was involved in the migration that led to the spread of the Tarand burial.

I don't comment on the genetic results because I don't have the necessary material to make comparisons.

Edit 21.12.24 12:30-13:30

I found those popular Eutogenes G25 coordinates for the study samples. Eurogenes G25 is a axmixture in good and bad.  Using ancient samples there is certain value, but using modern populations you can't make decisions about the origin or ancestry. 

Here three results of Finns, first my own result.  


Target: maurim1_scaled
Distance: 0.6842% / 0.00684208
26.2Shetlandic
22.8Ingrians
18.6Pskov_(Porkhov)
8.4Ingrian_Finns
5.0Votes
4.8Veps
4.4Karelians_(North)
3.6Karelians_(SW_Karelians_(SW_Livvi)
3.2Lithuanian_VZ
1.2Lithuanian_PZ
0.8Dusun
0.8Shor_Khakassia
0.2Karitiana


Target: Finnish_Southwest
Distance: 0.7902% / 0.00790222
26.2Karelians_(Tver)
23.0Icelandic
17.8Ingrians
14.4Veps
9.8Ingrian_Finns
7.6Karelians_(SE_Karelians_(SE_Ludic)
1.2Shetlandic


Target: Finnish_East
Distance: 0.6825% / 0.00682458
45.8Ingrians
41.0Ingrian_Finns
7.4Karelians_(North)
2.8Saami
1.2Veps
0.8Norwegian
0.6Mari
0.4Ethiopian_Anuak

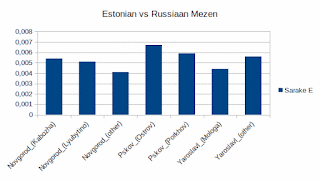
Here results for the study sample averages. I used dist col 0.5 to avoid excessive columns. The last column is Russian Ryazan

Friday, November 22, 2024

N haplogroup in FamilytreeDna

All YDNA haplogroups can be found in FamilytreeDna's distribution maps. The results are based on the results of their customers and the ancestry information they provide. The global coverage of the samples is affected by customer activity in different regions and countries, where there is great variation. In Western Europe, the coverage is good, but e.g. finding out the prehistoric origin of Finnish samples belonging to the N group is hampered by the lack of samples from Eastern Europe and Asia on FamilytreeDna's maps. In addition, it would seem that FamilytreeDna's knowledge of the historical structure of the N-haplogroup is incomplete, which fact is reflected in the classification of the samples into different levels of the haplotree. Due to these shortcomings and illogicalities I don't see it as possible to draw similar conclusions about the course of prehistory as I did with Finnish haplogroup I.  Please give feedback directly to FamilytreeDna, as these maps, if logical, would be very useful.


Y5005


CTS6496


Z1941


VL62


CTS8565


Z1936


VL29


CTS9976


L1025


L550


CTS6496+CTS7189


Monday, November 11, 2024

FamilytreeDna's new reports give comparisons to ancient DNA

 FamilytreeDna has increased its YDNA-based reporting since last seen and is now state of the art in YDNA science. Below is a comparison based on my own SNP mutations to ancient samples. Ancient samples are now new in FamiliyreeDna's YDNA reporting. The two samples closest to me that have been successfully classified are Ladogan Viking sample VK220 and Viking Age Sigtuna sample 84005/nuf005. Interestingly, I have previously tested the latter sample with the Eurogenes G25 test and it was found to be partly Finnish. I have personally tested both samples for the CTS2208 group. FamilytreeDna can reach the slightly more accurate classification Z26344, which is a new classification found after my own test. I'm going to try repeating the test at a lower quality level to see if the test shows any new results.  Additional mutations between 800 BCE - 1200 CE are likely, but the result depends on the sample quality.  

Anyway, I'm happy with the results. When the TMRCA to me is 800 BCE (age of CTS2208/Z26344) for these two and the  oldest Finnish I-branch with certainty is 2200 years old (FtDna), then only 600 years of unexplained time remain in between. The next major upstream from the Finnish clade is CTS7676 and isn't identified by Finnish samples. CTS7676's TMRCA in Sweden is 2600 years (FtDna). With it the difference  shrinks to 400 years. This is amazing. By modern samples CTS 7676 is purely Swedish (Yfull 24 samples, of which 22 are from western Sweden, can also be read as Norwegian in that period) and its closest branch to the downstream is Finnish  L287/L258 as mentioned above.  So the transition time from Sweden to Finland has been 400 years (look the picture below, made by FamilytreeDna),  which dates to the very end of the Bronze Age and to the pre-Roman Iron Age.

During that time, cattle breeding and farming became a new way of life on the west coast of Finland. There was small-scale farming in Finland before, but livestock farming in this area was a typically Scandinavian way. Burials became barrow grave burials and stone cist burials. Connections with Scandinavia became more common. It is estimated that the Finnish language came to Finland 600-1000 years later. According to the estimate, the Sámi arrived in 500 BCE, that is exactly that period, but they came from the east. The economy based on agriculture and cattle breeding has not been connected to the Sami people (need to be checked). The Sami language is dated to be older than this period and the origin in the Urals.  They have preserved their language to the present day. The Germanic loanwords of the Sámi language date to this period.

This was an exceptionally long text from me. Thank you for your time and reading.    This subject is important to understand later Finnish history.

______________________________________________

Z26344 is an immediately downstream mutation for CTS2208.  FamilytreeDna dates both to 800 BCE.  It is safe to say that both seem to have a Swedish origin (see my previous post and older posts -> link).  FamilytreeDna really puts things into perspective.

Sample location | sample dated | mutation  | TMRCA with me

Salme 700-800 CE Z2338 1800BCE

 Hundstrup  670-830 CE Z2338 1800BCE

 Koksijde 667-820 CE Z2338 1800BCE

 Hundstrup 670-820 CE Z2338 1800BCE

 Wolverton 600-671 CE Z2338 1800BCE

 Szolad  412-604 CE Z2338 1800BCE

 Sandby Borg 450-500 CE Z2338 1800BCE

 Czulice 395-418 CE Z2338 1800BCE

 Pruszcz Gnanski 100-300 CE Z2338 1800BCE

 Sweden Skara 900-1200 CE CTS6868 1700 BCE

 Salme 700-800 CE CTS6868 1700 BCE

 Denmark historical 1650-1850 CE Z74 1450 BCE

 St Johns 1294-1511 CE Z74 1450 BCE

 Ahlgade 1000-1550 CE Z74 1450 BCE

 Västerhus 1016-1262 CE Z74 1450 BCE

 Hofstadir 900-1300 CE Z74 1450 BCE

 Ladoga 900-1200 CE Z74 1450 BCE

 Silastadir 980-1020 CE Z74 1450 BCE

 Hrolfsstadir 870-1000 CE Z74 1450 BCE

 Silastadir 850-1000 CE Z74 1450 BCE

 Nordland 790-1100 CE Z74 1450 BCE

 Bodkerkarden 800-900 CE Z74 1450 BCE

 Nordland 700-900 CE Z74 1450 BCE

 Ã–land 700-800 CE Z74 1450 BCE

 Salme 700-800 CE Z74 1450 BCE

 Rombäck 450-500 CE Z74 1450 BCE

 Rombäck 450-500 CE Z74 1450 BCE

 Nunnan (nuf005 or 84005) 900-1200 CE Z26344 800 BCE

 Ladoga (VK220) 900-1200 CE Z26344 800 BCE

Edit 12.11.24 20:40 

After more intensive searching at FamilytreeDna I found a picture showing that 84005 and VK220 diverged from the ancestral lines of Finnish L287/L258 soon after the CTS2208 (it will say around 700-800 BCE. 


Edit 12.11. 24 23:20 - 13.11.24 23:20

I corrected some TMRCA-values and for consistency with datings I ended up to use only FamilytreeDna's datings.  FamilytreeDna has much more samples for TMRCA calculations, but their data confidentiality rules prevent me use their sample data.  Yfull reports sample ids and ISOGG classifications.  Sorry about inaccuracy in my original text.  It happens when you try to combine information from multiple sources, plus building logical and coherent texts in foreign language isn't as simply as using your mother language.  I hope that now datings and text logic are fine. 

Tuesday, November 5, 2024

Additional information about the Finnish Z133 clade

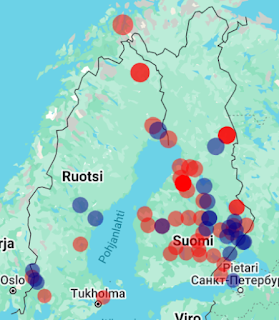
FamilytreeDna provides additional information on Finnish subgroups of the YDNA I1 haplogroup. FamilytreeDna certainly has the widest selection of YDNA samples, so you can trust the results with great certainty. What makes the results interesting is that FamilytreeDna reports the map locations of the samples based on the ancestral information of the sample owner. This information is mainly based on church records or population register data of ancestors. In the results, based on the TMRCA values mentioned in my previous update, you can see the places of residence of the ancestors of the young Z133 group. It is particularly interesting to note that, based on the ancestral data, the historical starting point of the group Z133 can be found, not only in South Ostrobothnia, but also in Karelia, which was handed over to Russia after WWII. It is natural to assume that a large part of the Eastern Finnish Z133 samples have come from the ceded Karelia during the last 500 years of the historical time period. Migration from the Karelia can extend even more to the past, but the Finnish census and church registers are not available from the time before the 16th century.  

This example proves that interpreting the present requires knowledge of history. How Z133 ended up in Karelia, I don't dare to present my interpretation, although according to known prehistoric information I see a coherent explanation.

Each dot corresponds a group if samples, but FamilytreeDna doesn't tell the logic and how the maps are scaled.

Z133:


In addition, the Finnish L258:


And only CTS2208, whose downstream branch the L258 is:


Thursday, October 31, 2024

New Finnish study sheds light on YDNA

The research (link) shows that haplogroup N1 is divided into two groups, eastern and southern. This has been known to hobbyists for more than 10 years, but the matter has not been observed by researchers before now. It's already been 16 years since the last Finnish ydna study, so it's good that this issue has now been updated.

The study also provides additional information about the I1 haplogroup, which interests me more.

For a comparison, in Yfull, 244 specimens belong to L258, which is the biggest Finnish I1 group.

CTS2242, the largest I1 group of the study, mainly from South Ostrobothnia and Eastern Finland, covers about 35% of L258 in Yfull. The largest subgroup of CTS2242, Z133 (Z2043 in the study), has been identified with good accuracy.  In Eastern Finland the Z133 is probably from Karelia and from the exchange of population between South Ostrobothnia and Central Finland. Most of its samples have TMRCA values ​​less than 500 years. In Yfull, CTS2242 covers 85 samples, of which 12 are in places other than South Ostrobothnia and Eastern Finland. Big value for this particular group must have come from the regionally uneven weighting of the data. The groups Y13391, Z2046, BY510 and Y107833 in the haplotree at the same level with CTS2242 are missing from the material. Some of the assignments lack the ISOGG classification, even though it should be known. The main branch Y13391, larger in diversity than CTS2242, is missing. It is perhaps 20% of the sample size under  L258, covering 50 samples in Yfull, of which 27 are outside South Ostrobothnia and Eastern Finland

The data is very uneven in its geographical distribution, which is why I also doubt the relative distributions of the downstream  haplogroups of N1.

Friday, October 4, 2024

Swedish study: Scandinavian wolves are genetically pure

 Research (link)  shows that Scandinavian wolves are racially pure and have not mixed with dogs. According to the study, canine hydridism is a problem elsewhere in Europe. A Swedish study states that the Scandinavian wolves are of eastern origin and that the origin of the migration was Finland and Karelia in Russia. Wolves clearly more eastern than this belong to a different stock and the Chinese wolf turns out to be a hybrid. Pure wolf populations can also be found in North America.


The research is methodologically convincing. The selection of material for individual tests has been successful, considering the small size of wolf populations in Fennoscandinavia. Among other things, efforts have been made to eliminate the influence of close relatives on the results.  The effect of small populations is still clear in the PCA plots,  it would have been impossible to avoid totally.  It would have been good to eliminate relatives also in research when searching for the origin of Finnish Homo Sapiens. Of course, the scientific objective attitude is probably easier to follow in the case of wolves than in the case of linguistic and state institutions.

Thursday, October 3, 2024

New Russian study about the Finnish ancestry in Russia

 Research (link) shows that Finnish heritage (IBD based) is common among Russians. Unfortunately other Finno-Ugric-speaking peoples, such as Komi and Volga Uralics, have not been included in the study. By adding these, we would get a better picture of the origin of this gene. Now the gradient indicates a Finnish origin, which is unlikely. It is also noteworthy that the IBD distribution shows that Finns have more West and Central European heritage than Russians.


The second figure describes the population bottleneck effect (effective population as a function of time). These tests are, in my experience, very unreliable, as are all tests of drift in supposed historical populations. Based on the current population structure, it is not possible to say what the population structures were like in prehistoric times. The drifts and their areas of influence have been different in different times.  This way, there could have been several regional subpopulations, bottlenecks and expansion times  at different times. This method is not suitable for historical research. Now only averages and evaluations are obtained in the test.  I was hoping for a larger number of populations in this case as well. 

Sunday, September 15, 2024

Finnish genetic diseases

The research I linked in my previous post brought to mind the question of Finns' excellent genetics. Now that even Wikipedia tells about the Finns' 4000-year-old genetic bottleneck and disease inheritance, I will link here texts about the birth history of this inheritance. When talking about the  history of genetic diseases for typical Finns, we talk about about 40 diseases, which are more common in Finns than in the rest of the world.


The texts  (link) and (link) describe that the origin of these 40 diseases dates back to the time of King Gustav Vasa of Sweden (link).  A small local population in southeastern Finland (a few hundred families, a link, text in Finnish), attracted by the free land promised by Vasa, dispersed over a wide area, establishing small village communities.  You can find more similar descriptions about this topic, but unfortunately only in Finnish.  Readers in Finland can use them.  Unfortunately the text behind the first link, despite of telling right about the age of Finnish disease inheritance, falls into a storytelling mode when describing the older Finnish ethnic history, leading to a contradiction whether the genetic bottle neck causing genetic diseases existed during the first or the latter occurrence.   This underlines how observant reader has to be when noticing incoherences in texts.  The latter text, written by a pioneer of the Finnish genetic research is more informative (remembering Reijo Norio's visionary work).

This southeastern Finnish population was formed during Sweden's third crusade (link) towards Finland, when Sweden and Novgorod divided the lands of the Karelians at the end of the 13th century. In the 16th century, in these new village communities of Gustav Vasa's time, certain alleles leading to disease inheritance were enriched. Although this description of one population of Southeast Finland in the 13th century does not quite tell the whole truth about the events, it describes well enough the course of events on a general level as the population rushed to the north, west and east in the hope of free farmland.


Finns have not lived here for 4000 years, hardly even 2000 years (link).  This is the idea you get today from archaelogists and linguists.  During the last twenty years there has been improvement in the research, yet it is difficult to find sources in English.  On the other hand stories offered on the internet tell about a handful of Finns who lived in Finland 4000 years ago (population size being 3000) is complete bullshit, which is served to an international readership in order to improve the story.  By a google search you can find  hundreds texts descripting the population age of Finns from the Ice Age.  Nothing beats a good story.  

Archaeological finds don't tell about spoken language, but most studies suggest that the migration representing most likely modern Finns came to the Southwestern Finland during the late Roman Iron Age.  This match well with the recent linguist evaluations of the Finnish and Estonian linguists (link).


In the text I linked first you find descriptions of "early settlements" and "late settlements". Late Settlements roughly describes this new settlement area from the time of Gustav Vasa, early settlements is an area that was mainly settled from 200AD to 1200AD by the southwestern Finnish root population. Although Finns have significantly mixed with each other during the 20th century due to economic changes, this phase of settlement history is still very clearly visible in all genetic test results, such as FST, IBD and PCA tests.


More about the topic, Link

More reading, in Finnish, link


Edit Mon 16. Sept. 10 pm.

Two pictures from Reijo Norio's book "Suomi neidon geenit".


In the first picture, CNF-disease carrier distribution over ages. Finnish type (CNF or NPHS1), is an autosomal recessive disease. The disease is most common in Finland, but many patients have been identified in other populations (although the mutation can be different).  I would see it as a genuine mutation that occurred in the Finnish root population. It is not clear if it was born in Finland or did it appear in the population before it arrived in Finland.


The second picture shows the main distribution of genetic diseases in Finland, with the east-west division assumed by the author. How the diseases were chosen for the picture is not clear to me, but I would assume that the distribution reflects the Iron Age, the black dots representing alleles distributed by Sámis and red ones by Finns.


Friday, September 13, 2024

Fst test is a special case

 The genetic history of Finns is surprisingly poorly known. Words are used in a general sense and generalizing. It has become a habit to enhance one's own knowledge with expert vocabulary in different contexts without real context. For example, the genetic disease inheritance of Finns is used to describe the homogeneity of Finns and the old bottleneck of the Finnish population. However, this inheritance is regional, peripheral, and not even old. Regional genetic drifts are generalized to cover the homogeneity of the entire population. This is not the case, but different regions of Finland have also their own admixture, a very young Sámi mixture in the north, Swedish mixture in the west and south. Older admixtures include the Iron Age Estonian and Sami admixture of the entire population and the even older Germanic admixture.

Incorrect assumptions lead to incorrect conclusions and results. The fst results of the Estonian study, link, are right, yet could be more informative. It comes out by dividing the Finnish samples into decile groups based distances to the Estonian data. There are 10 samples in each decile and the result reflects the diversity of Finns in fst tests. The final result depends on the testing method, for example admixture tests would give a different result, but the error sources should be taken into account according to the method. I also tested with the same deciles against the British, although the decile division made on the basis of Estonian data does not give a correct picture of the Britts in relation to the Finns. 

Due to the nature of the fst test, the result based on the entire population does not give sensible fst distances of the Finns. In principle, we can take any set of samples and assume the meaning we want, but it would be better to analyze first, because every method tends to have own pitfalls.

The material has been downloaded from the 1000 genomes Project and Reichlab's Human Origin data.


Monday, September 9, 2024

Making sense of the I1-CTS2208 clade


The I1-CTS2208 clade is mostly a Scandinavian I1 clan and can be assumed to have originated in southern Sweden (?). Its root to the present is 2900-3900 years old (source Yfull, formed 3900 ybp, TMRCA 2900 ybp). From Sweden, it expanded its territory radially to nearby areas. It has been particularly successful in Finland, where its share of the male population is around 30%.

The test material was downloaded from Familytreedna's I1 project and all samples cover 67 str markers.  Due to the significant Finnish emigration to nearby areas, I removed from the material all samples of the Finnish clan found in Sweden, Norway and Russia (in Russia, most of these are ancestors from Karelia, which was handed over to Russia in the war). In practice, all of these Finnish samples represent a young migration movement, and most of them can easily find a Finnish root in the Finnish church records. In addition, I removed similarities that indicate close kinship from the large Finnish material.


The results clearly show an old overlap in the Finnish and Swedish samples, with the Swedish samples placed at the root in time (Yfull).  It would be interesting to look at the TMRCA of those overlapping samples.   The timings of the I1 tree can be examined in YFull. It should be noted that the neighbor diagram does not represent the age structure, but the distance of the samples and the tree structure arise from the genetic distances of the sample set, regardless of TMRCA's between samples or sample groups. In contrast to similar posts I did earlier, where the results were based on TMRCA data, now the results are based on str data.  Germany, Ireland, Poland and Denmark consist of one sample  each.


Tuesday, June 4, 2024

Men's testosterone levels declining

 The number of ancient genome samples from the vicinity of Finland has grown commendably in recent years. In my last writings, I have dealt with the genetic history of Finland's neighboring regions. For Finland, the situation is difficult; our acidic soil destroys the material effectively, and material over 1000 years old can only be found in exceptional cases, when the burial site is located in a place more favorable to the environment. According to rumors, some samples older than this would have been successfully sequenced, e.g. From southwestern Finland and northern Ostrobothnia. However, I cannot confirm this. While waiting for the publication of new Finnish ancient genetic studies, I try to keep my blog active with other considerations.

According to statistics, testosterone levels in men have decreased by 15% in the last 20 years. If it is tue, I think this is alarming. Undoubtedly, this could have adverse effects for the human species. Simultaneously with the decrease in testosterone level, sperm production in men has also decreased. An obvious connection, but what do the researchers say? Three reasons have been proposed for the phenomenon: - environmental toxins, plant protection agents and microplastics - unhealthy food that lacks many important trace elements, such as zinc and magnesium - feminization of society. Feminization would affect the way of life practiced by men and decrease the amount of testosterone level through lack of physical exercise and mental change, or in the longer term through pairing. It would be interesting to know if the decrease in testosterone is reflected in our genes. Are we poisoned by environmental chemistry and our food, or is the change also reflected in our inheritance? How should this decrease in testosterone be treated? Does it have negative or even positive effects on the future of our life? Environmental toxins are without a doubt something to be avoided, but it is difficult for an individual to avoid their intake. In the case of unhealthy food, the responsibility lies more with the individual himself, but the influence of society is also big. The feminization of society (which you can either recognize or not) would be seen, for example, in the changed upbringing of children, or its effects would be seen with a delay through mate selection in posterity. As living conditions improve and security increases, women might give priority to less masculine men. The change that took place through this would be visible in the inheritance of offspring, and it may be possible to ascertain it through research. All in all, the decline in men's testosterone is related to complex phenomena and finding out the reasons would be a challenging task, but it would be good to find out why and the effects https://www.reuters.com/article/idUSKIM169763/

Thursday, May 9, 2024

Estonian study from 2020 deepens the Estonian genetic geography

 The Estonian study Vasili Pankratov et al.  (link) shows the genetic structure of Estonians and the relationship of each province to the geographical environment. The research does not really bring anything new, but it does confirm a lot of what is already known with the help of extensive genetic material. In sum, the population of the northern parts of Estonia is more mixed than the south and wider in diversity (shares smaller IBD episodes) and has a wider population base (Ne reading). All of a sudden, this destroys the notion of Estonians' heterogeneous Balticness and leaves the Finnish and Russian demographic influence in Estonia still open.  

Comments

- figure 1 (b) describes the relationship of other populations with Estonians more than the relationship of Estonians with other populations, especially for the reason that no reference groups have been presented for Northern Russians.

- finestructure is not capable of historical context and easily gives misleading results about the origin of populations. Waiting for an analysis capable of historical context...