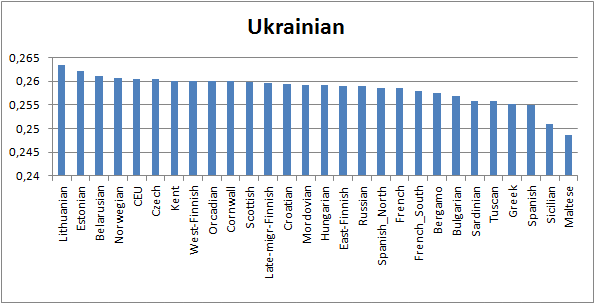
F3-statistics
measures common genetic drift between populations. I have done a simple run using ancient genomes and Eigensoft’s qp3Pop program, comparing all those ancient genomes to present-day populations
and moved results to Excel graphics. The
bigger the result is the more the present population shares drift with ancient
samples.
Ancient
genomes:
Loschbour M
Luxembourg_Mesolithic
LBK F GermanStuttgart_LBK
Otzi M Tyrolean_Iceman Copper Age
MA1 M Siberian_Upper_Paleolithic
AG2 M Siberian_Ice_Age
Scandinavian_HG M Swedish_HunterGatherer
Neolithic
Scandinavian_farmer F Swedish_Farmer Neolithic
Motala12 M Swedish_Motala 7000 years old
LaBrana M
LaBrana Mesolithic
AngloSaxon
several samples UK Hinxton Iron Age
Briton
several samples UK Hinxton Iron Age
NE1…NE7 Hungarian Neolithic
KO1
Hungarian Neolithic
CO1
Hungarian Copper Age
IR1
Hungarian Iron Age
BR2
Hungarian Bronze age
The formula is f3(Mbuti;test1,test2)
The formula is f3(Mbuti;test1,test2)
All results
can be downloaded and unzipped here.
I couldn’t
resist to look why I have at 23andme many “cousins” in Southern Russia and
Ukraine, but no one in Nothern Russia.
This looked weird because I have heard always that the Finns are from
the north. Indeed, Western Finns, like
me, are closer Ukrainians in terms
of the common genetic drift than Northern Russians (Mordva and Russian people closer
White Sea). Surprising.

No comments:
Post a Comment
English preferred, because readers are international.
No more Anonymous posts.